Sample Configurations
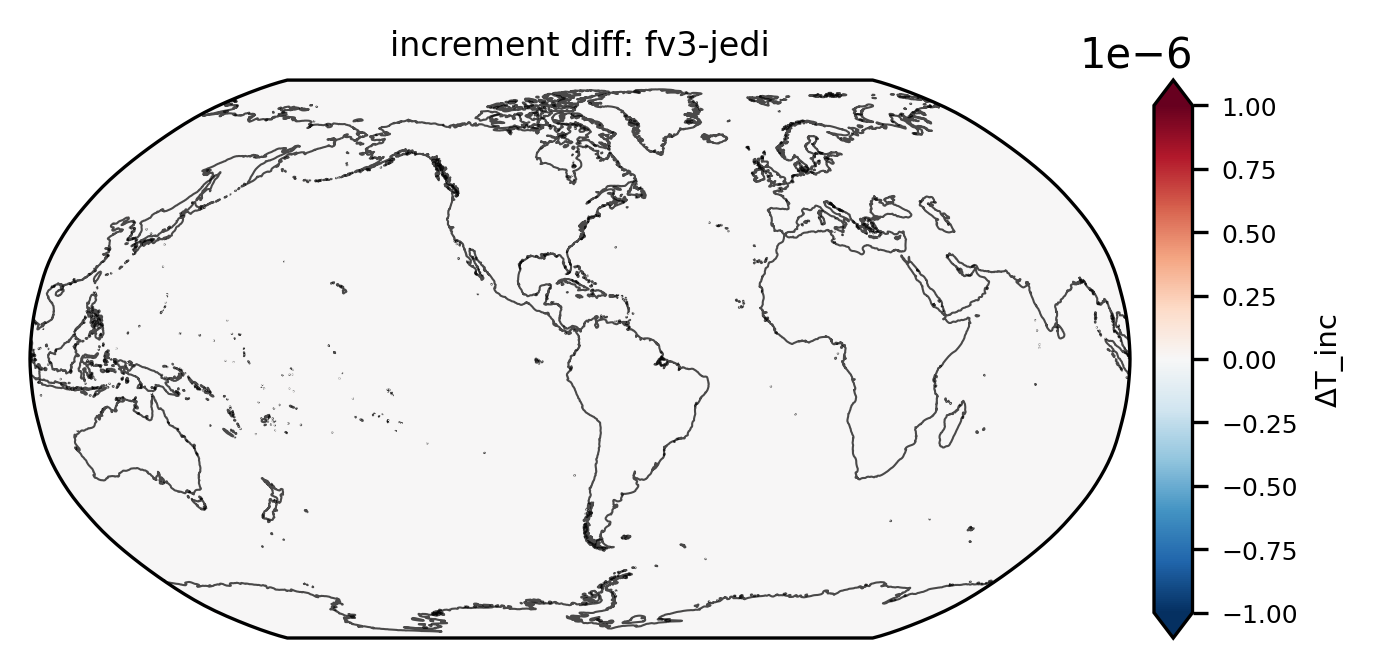
Difference plot between FV3 and JEDI increment files
input:
  parameters:
    cycle: t00z
    PDY: 20240224

  datasets:
    - name: fv3
      data_model: fv3          # fv3 | mom6 | cice | ww3 | jedi | ioda | etc.
      data_kind: increment     # increment | analysis | forecast | restart | observation | etc.
      geo:
        path: /Users/chjeon/My_Doc/DATA_ref/grid/C96
        filename: C96.mx100_oro_data
        file_type: orog        # file | orog | tile
      data:
        path: /Users/chjeon/My_Doc/DATA_ref/atm
        filename: ufsda.t00z.atminc.cubed_sphere_grid
        file_type: tile        # file | tile
        var_list:
          - T_inc
          - u_inc
          - v_inc
        z_index: 76
        time_index: 0
      colormap:
        default: gist_ncar_r
        T_inc: RdBu_r
        u_inc: RdBu_r
        v_inc: RdBu_r
      range:
        default:
          vmin: null
          vmax: null
        T_inc:
          vmin: -2.5
          vmax: 2.5
        u_inc:
          vmin: -5
          vmax: 5
        v_inc:
          vmin: -5
          vmax: 5
      title: "fv3 increment"

    - name: jedi
      data_model: jedi         # fv3 | mom6 | cice | ww3 | jedi | ioda | etc.
      data_kind: increment     # increment | analysis | forecast | restart | observation | etc.
      geo:
        path: /Users/chjeon/My_Doc/DATA_ref/atm
        filename: cubed_sphere_grid_atminc.jedi.nc
        file_type: file        # file | orog | tile
      data:
        path: /Users/chjeon/My_Doc/DATA_ref/atm
        filename: cubed_sphere_grid_atminc.jedi.nc
        file_type: file        # file | tile
        var_list:
          - tmp
          - ugrd
          - vgrd
        z_index: 76
        time_index: 0
      colormap:
        default: gist_ncar_r
        tmp: RdBu_r
        ugrd: RdBu_r
        vgrd: RdBu_r
      range:
        default:
          vmin: null
          vmax: null
        tmp:
          vmin: -2.5
          vmax: 2.5
        ugrd:
          vmin: -5
          vmax: 5
        vgrd:
          vmin: -5
          vmax: 5
      title: "jedi increment"

  differences:
    - name: jedi-fv3
      base: fv3
      target: jedi
      var_pairs:
        - base: T_inc
          target: tmp
        - base: u_inc
          target: ugrd
        - base: v_inc
          target: vgrd
      colormap:
        default: RdBu_r
        T_inc: RdBu_r
        u_inc: RdBu_r
        v_inc: RdBu_r
      range:
        default:
          vmin: null
          vmax: null
        T_inc:
          vmin: null
          vmax: null
        u_inc:
          vmin: null
          vmax: null
        v_inc:
          vmin: null
          vmax: null
      title: "increment diff: fv3-jedi"

output:
  path: ./plot
  prefix: atminc

plot:
  cartopy_ne_path: /Users/chjeon/My_Doc/DATA_ref/NaturalEarth
  projection:
    name: Robinson    # Robinson | PlateCarree | Mollweide | NorthPolarStereo | SouthPolarStereo
    central_longitude: -77.0369  # D.C.
  figure:
    figsize: [5, 2.5]
    dpi: 300
  colorbar:
    extend: both   # neither | both | min | max
    size: "3.5%"
    pad: 0.08
    label_fontsize: 7
    tick_fontsize: 6
  title:
    fontsize: 8
  background:
    features:
      - coastline
      #- land
      #- lakes
      #- states
      #- borders
    resolution: 50m
    linewidth: 0.5
    alpha: 0.7
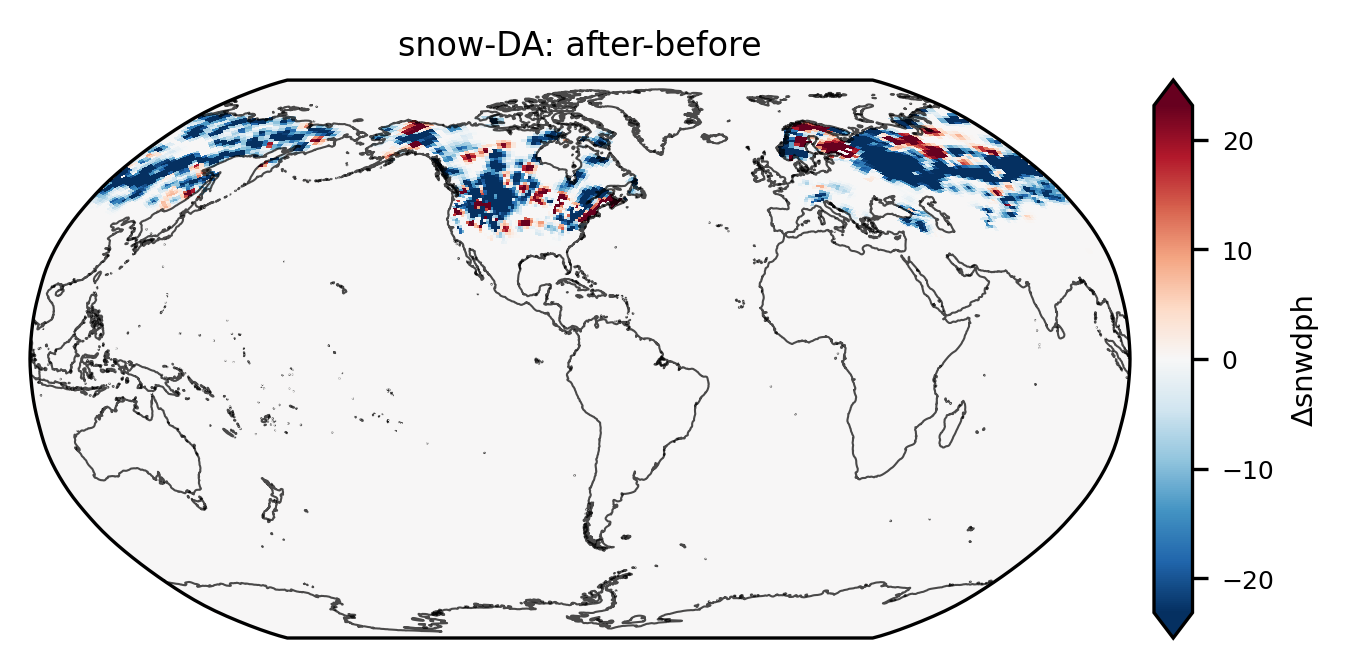
Difference plot between before and after JEDI analysis for snow-DA
input:
  parameters:
    cycle: t00z
    PDY: 20250121

  datasets:
    - name: before
      data_model: fv3          # fv3 | mom6 | cice | ww3 | jedi | ioda | etc.
      data_kind: analysis      # increment | analysis | forecast | restart | observation | etc.
      geo:
        path: /Users/chjeon/My_Doc/DATA_ref/grid/C96
        filename: C96.mx100_oro_data
        file_type: orog        # file | orog | tile
      data:
        path: /Users/chjeon/My_Doc/DATA_ref/land
        filename: 20250121.000000.sfc_data.before
        file_type: tile        # file | tile
        var_list:
          - snwdph
          - smc
        z_index: 0
        time_index: 0
      colormap:
        default: gist_ncar_r
        snwdph: null
        smc: null
      range:
        default:
          vmin: null
          vmax: null
        snwdph:
          vmin: null
          vmax: null
        smc:
          vmin: null
          vmax: null
      title: "snow-DA: before analysis"

    - name: after
      data_model: fv3          # fv3 | mom6 | cice | ww3 | jedi | ioda | etc.
      data_kind: analysis      # increment | analysis | forecast | restart | observation | etc.
      geo:
        path: /Users/chjeon/My_Doc/DATA_ref/grid/C96
        filename: C96.mx100_oro_data
        file_type: orog        # file | orog | tile
      data:
        path: /Users/chjeon/My_Doc/DATA_ref/land
        filename: 20250121.000000.sfc_data.after
        file_type: tile        # file | tile
        var_list:
          - snwdph
          - smc
        z_index: 0
        time_index: 0
      colormap:
        default: gist_ncar_r
        snwdph: null
        smc: null
      range:
        default:
          vmin: null
          vmax: null
        snwdph:
          vmin: null
          vmax: null
        smc:
          vmin: null
          vmax: null
      title: "snow-DA: after analysis"

  differences:
    - name: A-B
      base: before
      target: after
      var_pairs:
        - base: snwdph
          target: snwdph
        - base: smc
          target: smc
      colormap:
        default: RdBu_r
        snwdph: RdBu_r
        smc: RdBu_r
      range:
        default:
          vmin: null
          vmax: null
        snwdph:
          vmin: null
          vmax: null
        smc:
          vmin: null
          vmax: null
      title: "snow-DA: after-before"

output:
  path: ./plot
  prefix: snowAnal

plot:
  cartopy_ne_path: /Users/chjeon/My_Doc/DATA_ref/NaturalEarth
  projection:
    name: Robinson    # Robinson | PlateCarree | Mollweide | NorthPolarStereo | SouthPolarStereo
    central_longitude: -77.0369  # D.C.
  figure:
    figsize: [5, 2.5]
    dpi: 300
  colorbar:
    extend: both   # neither | both | min | max
    size: "3.5%"
    pad: 0.08
    label_fontsize: 7
    tick_fontsize: 6
  title:
    fontsize: 8
  background:
    features:
      - coastline
      #- land
      #- lakes
      #- states
      #- borders
    resolution: 50m
    linewidth: 0.5
    alpha: 0.7
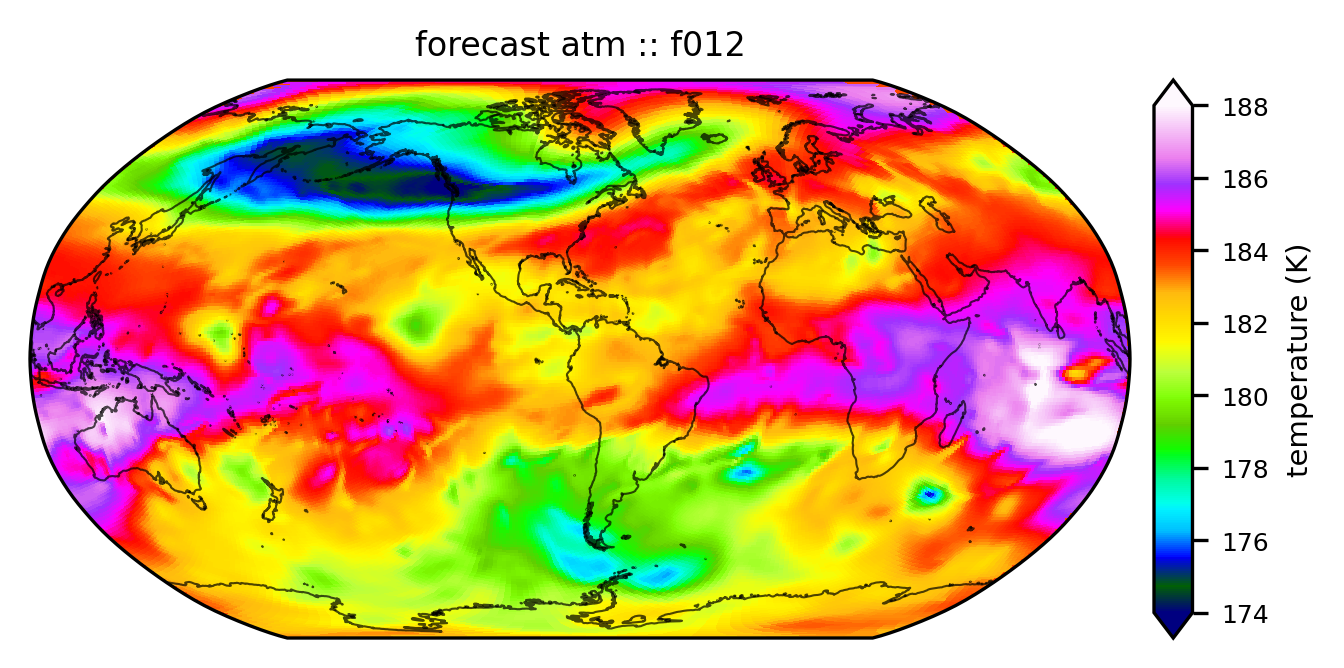
Forecast result plot (atm files)
input:
  parameters:
    cycle: t00z
    PDY: 20250121

  datasets:
    - name: atm
      data_model: fv3       # fv3 | mom6 | cice | ww3 | jedi | ioda | etc.
      data_kind: forecast   # increment | analysis | forecast | restart | observation | etc.
      geo:
        path: /Users/chjeon/My_Doc/DATA_ref/forecast
        filename: ufsda.t00z.atm.f*.c96.tile1.nc
        file_type: tile      # file | orog | tile
      data:
        path: /Users/chjeon/My_Doc/DATA_ref/forecast
        filename: ufsda.t00z.atm.f*.c96.tile1.nc
        file_type: tile      # file | tile
        var_list:
          - tmp
          - ugrd
          - vgrd
        z_index: 0
        time_index: 0
      colormap:
        default: gist_ncar_r
        tmp: gist_ncar
        ugrd: RdBu_r
        vgrd: RdBu_r
      range:
        default:
          vmin: null
          vmax: null
        tmp:
          vmin: 174.0
          vmax: 188.0
        ugrd:
          vmin: -120.0
          vmax: 120.0
        vgrd:
          vmin: -80.0
          vmax: 80.0
      title: "forecast atm"

output:
  path: ./plot
  prefix: fcst

plot:
  cartopy_ne_path: /Users/chjeon/My_Doc/DATA_ref/NaturalEarth
  projection:
    name: Robinson    # Robinson | PlateCarree | Mollweide | NorthPolarStereo | SouthPolarStereo
    central_longitude: -77.0369  # D.C.
  figure:
    figsize: [5, 2.5]
    dpi: 300
  colorbar:
    extend: both   # neither | both | min | max
    size: "3.5%"
    pad: 0.08
    label_fontsize: 7
    tick_fontsize: 6
  title:
    fontsize: 8
  background:
    features:
      - coastline
      #- land
      #- lakes
      #- states
      #- borders
    resolution: 50m
    linewidth: 0.5
    alpha: 0.7
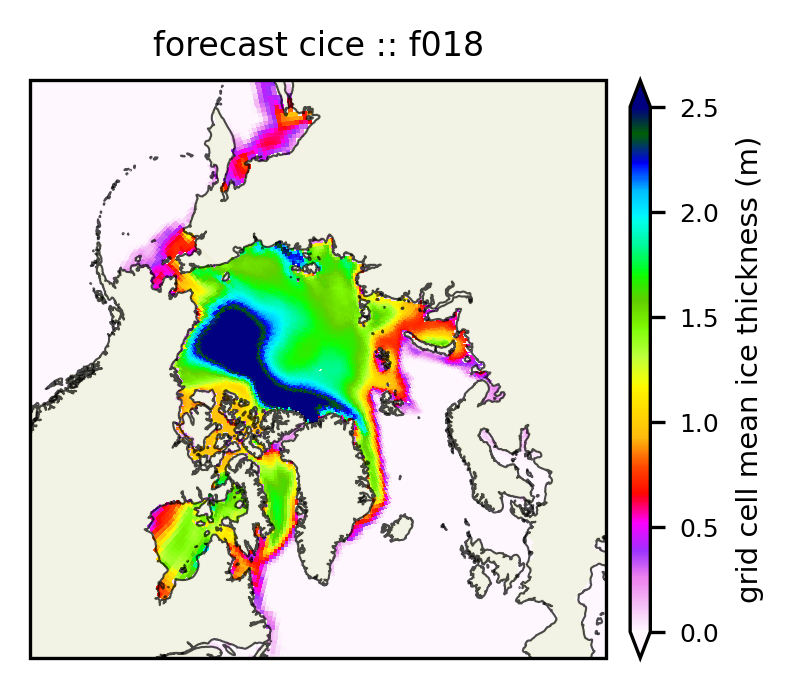
Forecast result plot (cice files)
input:
  parameters:
    cycle: t06z
    PDY: 20210322

  datasets:
    - name: cice
      data_model: cice       # fv3 | mom6 | cice | ww3 | jedi | ioda | etc.
      data_kind: forecast    # increment | analysis | forecast | restart | observation | etc.
      geo:
        path: /Users/chjeon/My_Doc/DATA_ref/ice
        filename: ufsda.t06z.ice.f006.mx100.nc
        file_type: file      # file | orog | tile
      data:
        path: /Users/chjeon/My_Doc/DATA_ref/ice
        filename: ufsda.t06z.ice.f*.mx100.nc
        file_type: file      # file | tile
        var_list:
          - hi_h
          - Tsfc_h
          - uvel_h
          - vvel_h
        z_index: 0
        time_index: 0
      colormap:
        default: gist_ncar_r
        hi_h: null
        Tsfc_h: Blues_r
        uvel_h: RdBu_r
        vvel_h: RdBu_r
      range:
        default:
          vmin: null
          vmax: null
        hi_h:
          vmin: 0.0
          vmax: 2.5
        Tsfc_h:
          vmin: -40
          vmax: 0
        uvel_h:
          vmin: -0.5
          vmax: 0.5
        vvel_h:
          vmin: -0.5
          vmax: 0.5
      title: "forecast cice"

output:
  path: ./plot
  prefix: fcst

plot:
  cartopy_ne_path: /Users/chjeon/My_Doc/DATA_ref/NaturalEarth
  projection:
    name: NorthPolarStereo    # Robinson | PlateCarree | Mollweide | NorthPolarStereo | SouthPolarStereo
    central_longitude: -45
  extent:
    lon: [-180, 180]
    lat: [50, 90]
  figure:
    figsize: [5, 2.5]
    dpi: 300
  colorbar:
    extend: both   # neither | both | min | max
    size: "3.5%"
    pad: 0.08
    label_fontsize: 7
    tick_fontsize: 6
  title:
    fontsize: 8
  background:
    features:
      - coastline
      - land
      #- lakes
      #- states
      #- borders
    resolution: 50m
    linewidth: 0.5
    alpha: 0.7
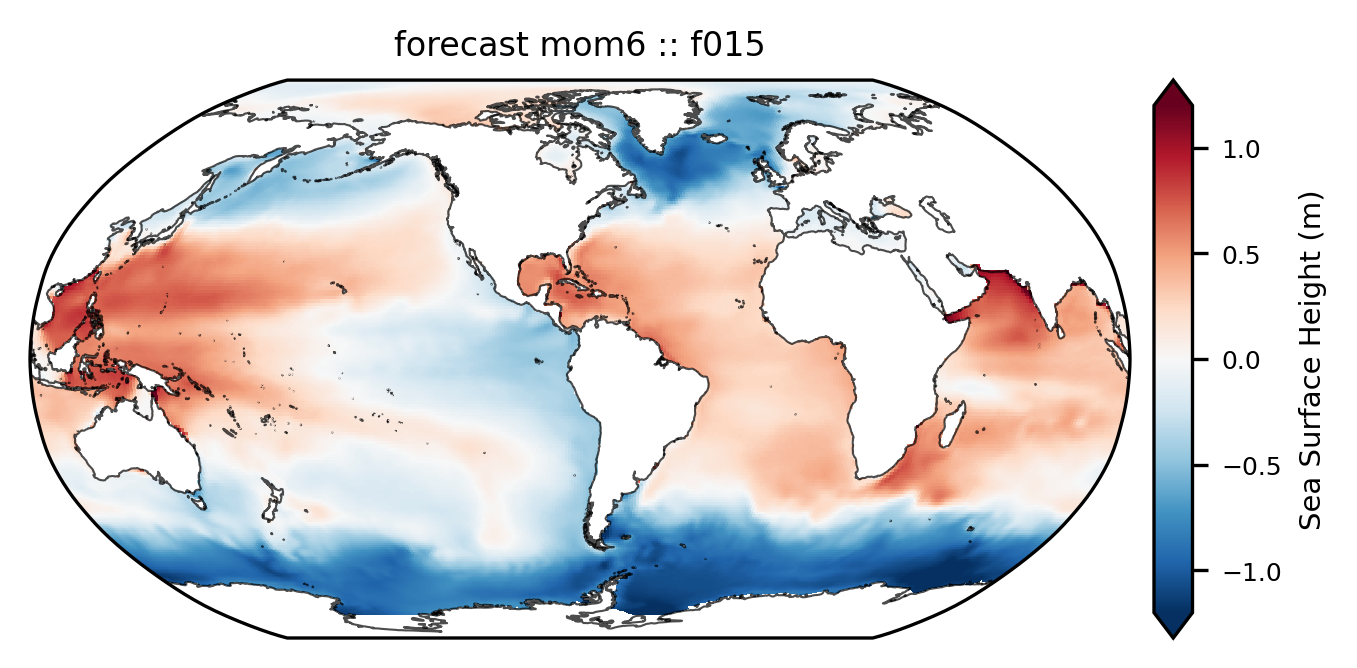
Forecast result plot (mom6 files)
input:
  parameters:
    cycle: t06z
    PDY: 20210322

  datasets:
    - name: mom6
      data_model: mom6       # fv3 | mom6 | cice | ww3 | jedi | ioda | etc.
      data_kind: forecast    # increment | analysis | forecast | restart | observation | etc.
      geo:
        path: /Users/chjeon/My_Doc/DATA_ref/marine
        filename: ufsda.t06z.ocn.f003.mx100.nc
        file_type: file      # file | orog | tile
      data:
        path: /Users/chjeon/My_Doc/DATA_ref/marine
        filename: ufsda.t06z.ocn.f*.mx100.nc
        file_type: file      # file | tile
        var_list:
          - SSH
          - SSU
          - SSV
        z_index: 0
        time_index: 0
      colormap:
        default: gist_ncar_r
        SSH: RdBu_r
        SSU: RdBu_r
        SSV: RdBu_r
      range:
        default:
          vmin: null
          vmax: null
        SSH:
          vmin: -1.2
          vmax: 1.2
        SSU:
          vmin: -1.0
          vmax: 1.0
        SSV:
          vmin: -0.6
          vmax: 0.6
      title: "forecast mom6"

output:
  path: ./plot
  prefix: fcst

plot:
  cartopy_ne_path: /Users/chjeon/My_Doc/DATA_ref/NaturalEarth
  projection:
    name: Robinson    # Robinson | PlateCarree | Mollweide | NorthPolarStereo | SouthPolarStereo
    central_longitude: -77.0369  # D.C.
  figure:
    figsize: [5, 2.5]
    dpi: 300
  colorbar:
    extend: both   # neither | both | min | max
    size: "3.5%"
    pad: 0.08
    label_fontsize: 7
    tick_fontsize: 6
  title:
    fontsize: 8
  background:
    features:
      - coastline
      #- land
      #- lakes
      #- states
      #- borders
    resolution: 50m
    linewidth: 0.5
    alpha: 0.7
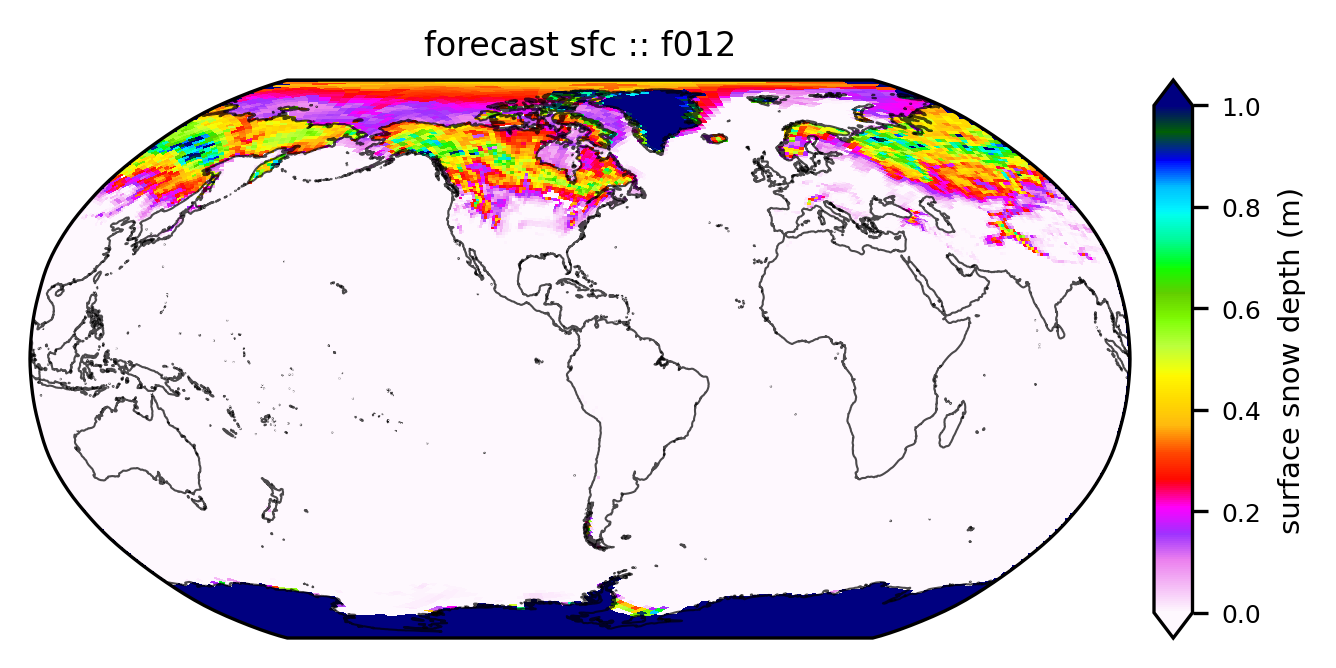
Forecast result plot (surface data files)
input:
  parameters:
    cycle: t00z
    PDY: 20250121

  datasets:
    - name: sfc
      data_model: fv3       # fv3 | mom6 | cice | ww3 | jedi | ioda | etc.
      data_kind: forecast   # increment | analysis | forecast | restart | observation | etc.
      geo:
        path: /Users/chjeon/My_Doc/DATA_ref/forecast
        filename: ufsda.t00z.sfc.f*.c96.tile1.nc
        file_type: tile      # file | orog | tile
      data:
        path: /Users/chjeon/My_Doc/DATA_ref/forecast
        filename: ufsda.t00z.sfc.f*.c96.tile1.nc
        file_type: tile      # file | tile
        var_list:
          - snod
        z_index: 0
        time_index: 0
      colormap:
        default: gist_ncar_r
        snod: null
      range:
        default:
          vmin: null
          vmax: null
        snod:
          vmin: null
          vmax: null
      title: "forecast sfc"

output:
  path: ./plot
  prefix: fcst

plot:
  cartopy_ne_path: /Users/chjeon/My_Doc/DATA_ref/NaturalEarth
  projection:
    name: Robinson    # Robinson | PlateCarree | Mollweide | NorthPolarStereo | SouthPolarStereo
    central_longitude: -77.0369  # D.C.
  figure:
    figsize: [5, 2.5]
    dpi: 300
  colorbar:
    extend: both   # neither | both | min | max
    size: "3.5%"
    pad: 0.08
    label_fontsize: 7
    tick_fontsize: 6
  title:
    fontsize: 8
  background:
    features:
      - coastline
      #- land
      #- lakes
      #- states
      #- borders
    resolution: 50m
    linewidth: 0.5
    alpha: 0.7
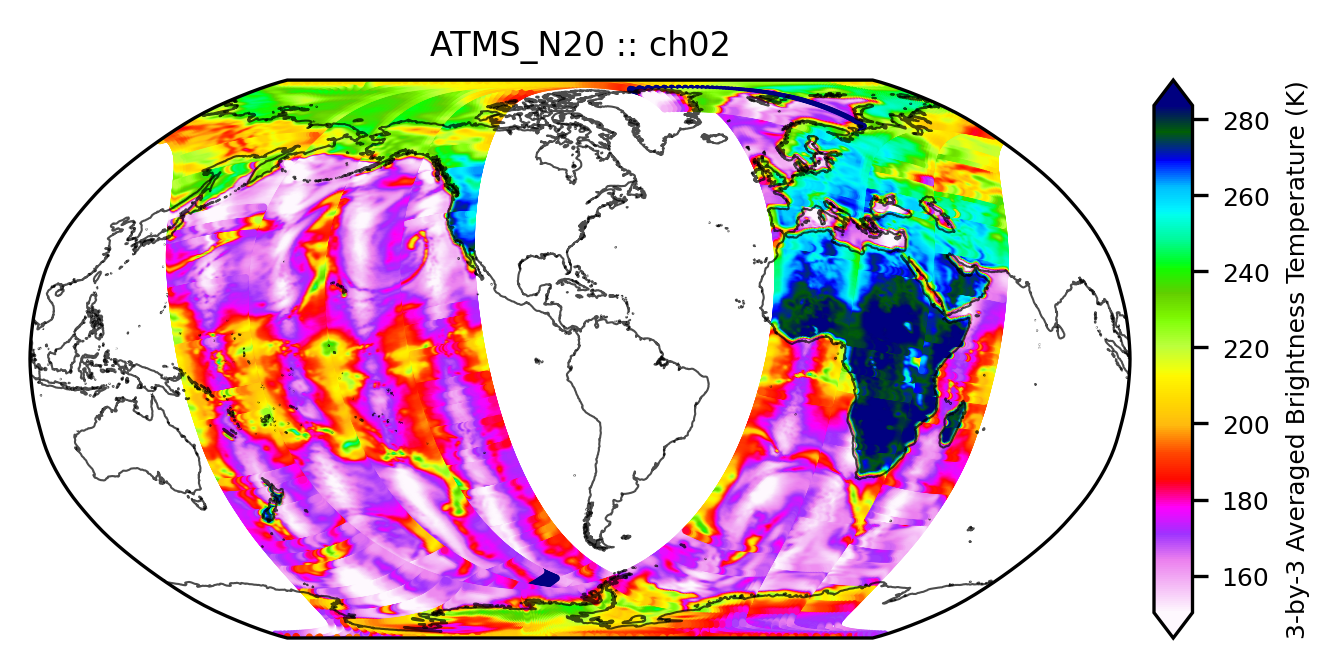
Observation file plot (IODA format)
input:
  parameters:
    cycle: t00z
    PDY: 20240224

  datasets:
    - name: atms
      data_model: ioda         # fv3 | mom6 | cice | ww3 | jedi | ioda | etc.
      data_kind: observation   # increment | analysis | forecast | restart | observation | etc.
      data:
        path: /Users/chjeon/My_Doc/DATA_ref/obs/fv3/20240224
        filename: obs.20240224.t00z.atms_n20.nc
        group: ObsValue
        var_list:
          - brightnessTemperature
        channels: [2, 7, 15, 22]
      colormap:
        default: gist_ncar_r
        brightnessTemperature: null
      range:
        default:
          vmin: null
          vmax: null
        brightnessTemperature:
          vmin: null
          vmax: null
      title: "ATMS_N20"

    - name: ghcn
      data_model: ioda         # fv3 | mom6 | cice | ww3 | jedi | ioda | etc.
      data_kind: observation   # increment | analysis | forecast | restart | observation | etc.
      data:
        path: /Users/chjeon/My_Doc/DATA_ref/obs/ghcn
        filename: obs.20250121.t00z.ghcn_snow.nc
        group: ObsValue
        var_list:
          - totalSnowDepth
        channels: null
      colormap:
        default: gist_ncar_r
        totalSnowDepth: null
      range:
        default:
          vmin: null
          vmax: null
        totalSnowDepth:
          vmin: null
          vmax: null
      title: "GHCN snow"

output:
  path: ./plot
  prefix: obs

plot:
  cartopy_ne_path: /Users/chjeon/My_Doc/DATA_ref/NaturalEarth
  projection:
    name: Robinson    # Robinson | PlateCarree | Mollweide | NorthPolarStereo | SouthPolarStereo
    central_longitude: -77.0369  # D.C.
  figure:
    figsize: [5, 2.5]
    dpi: 300
  colorbar:
    extend: both   # neither | both | min | max
    size: "3.5%"
    pad: 0.08
    label_fontsize: 6
    tick_fontsize: 6
  title:
    fontsize: 8
  scatter:
    marker_size: 0.5
  background:
    features:
      - coastline
      #- land
      #- lakes
      #- states
      #- borders
    resolution: 50m
    linewidth: 0.5
    alpha: 0.7
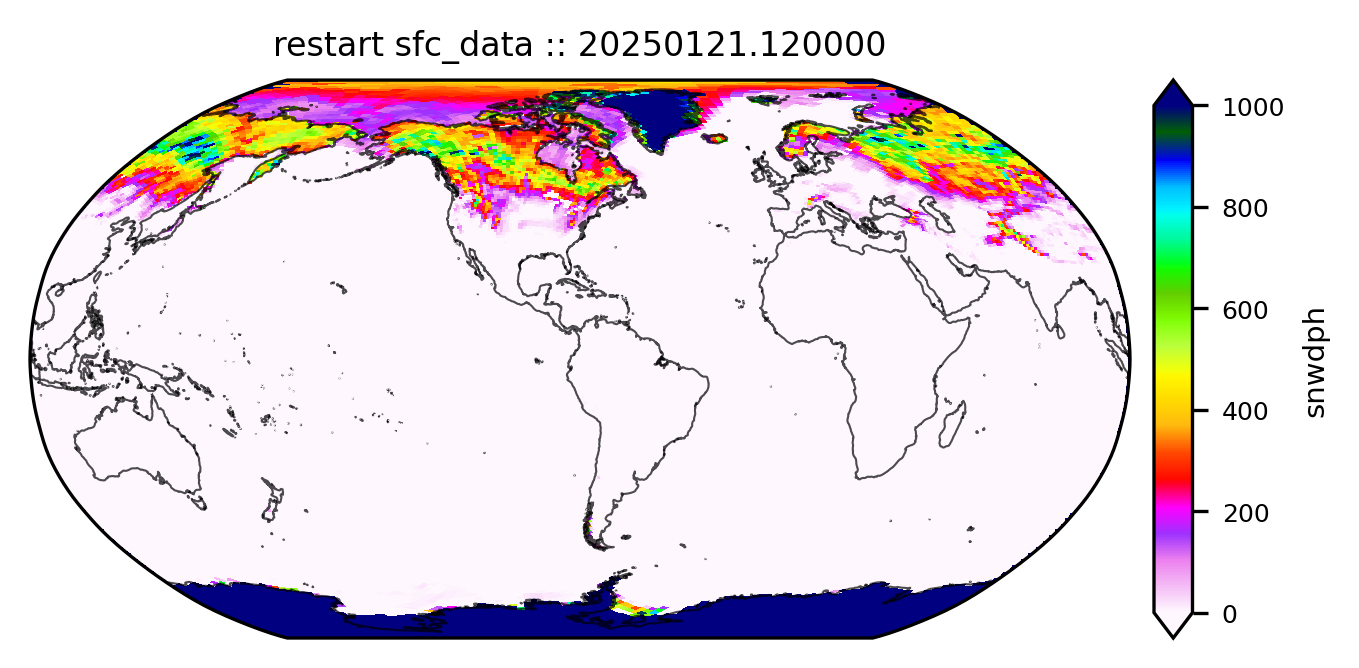
Restart file plot (UFS weather model)
input:
  parameters:
    cycle: t00z
    PDY: 20250121

  datasets:
    - name: sfc_data
      data_kind: restart   # increment | analysis | forecast | restart | observation etc.
      geo:
        path: /work2/noaa/epic/UFS-DA-Workflow_v1.0/inputs/DATA_fix/FV3/Tiled/C96
        filename: C96.mx100_oro_data
        file_type: orog      # file | orog | tile
      data:
        path: /work2/noaa/epic/UFS-DA-Workflow_v1.0/inputs/DATA_ref/restart
        filename: '*.sfc_data.tile1.nc'
        file_type: tile      # file | tile
        var_list:
          - snwdph
        z_index: 0
        time_index: 0
      colormap:
        default: gist_ncar_r
        snwdph: null
      range:
        default:
          vmin: null
          vmax: null
        snwdph:
          vmin: null
          vmax: null
      title: "restart sfc_data"

output:
  path: ./
  prefix: rst

plot:
  cartopy_ne_path: /work2/noaa/epic/UFS-DA-Workflow_v1.0/inputs/NaturalEarth
  projection:
    name: Robinson    # Robinson | PlateCarree | Mollweide
    central_longitude: -77.0369  # D.C.
  figure:
    figsize: [5, 2.5]
    dpi: 300
  colorbar:
    extend: both   # neither | both | min | max
    size: "3.5%"
    pad: 0.08
    label_fontsize: 8
    tick_fontsize: 7
  title:
    fontsize: 9
  background:
    features:
      - coastline
      #- land
      #- lakes
      #- states
      #- borders
    resolution: 50m
    linewidth: 0.5
    alpha: 0.7